Code Diagrams
ProjectHub automatically analyzes your project's code and transforms it into visual diagrams. Understand your code structure at a glance without any external tools.
Overview
Three types of diagrams are supported, each available as a separate tab:
| Diagram | Tab Name | Purpose |
|---|---|---|
| Flow Chart | Flow | Visualize function call flows |
| Class Diagram | Class | Visualize OOP structure (classes, inheritance) |
| SQL Diagram | SQL | Visualize database schemas |
Flow charts, class diagrams, and SQL diagrams are rendered using pure HTML/CSS/JavaScript with no external dependencies.
Supported Languages
| Language | Flow | Class | SQL |
|---|---|---|---|
| Swift | ✅ | ✅ | - |
| Python | ✅ | ✅ | ✅ |
| JavaScript/TypeScript | ✅ | ✅ | ✅ |
| Java | ✅ | ✅ | ✅ |
| Kotlin | ✅ | ✅ | - |
| Rust | ✅ | ✅ | - |
| Go | ✅ | ✅ | - |
| C# | ✅ | ✅ | ✅ |
| C/C++ | ✅ | ✅ | - |
| Ruby | ✅ | ✅ | ✅ |
| PHP | ✅ | ✅ | ✅ |
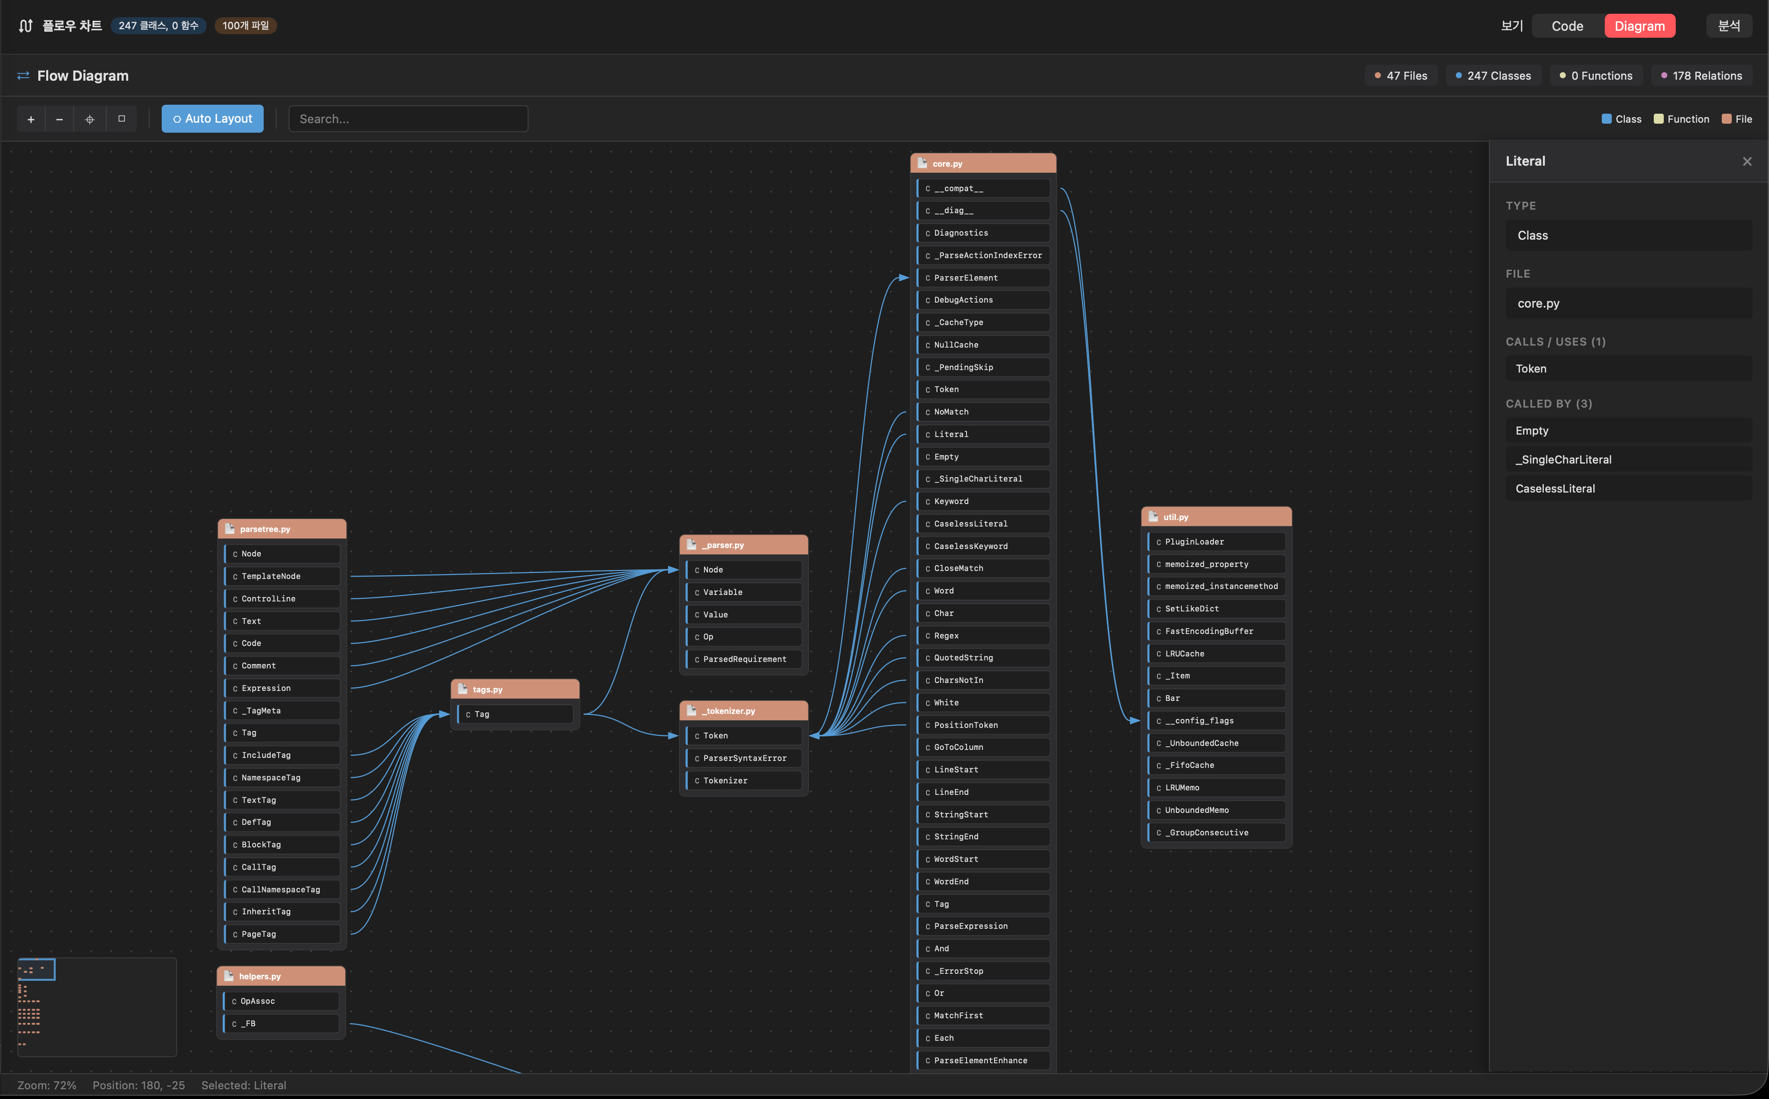
Flow Chart (Flow)
Visualizes the call relationships between functions within your project.
What It Analyzes
- Extracts function and method definitions
- Identifies call relationships between functions
- Detects entry points (main, entry point)
- Layers nodes by call depth
How to Read It
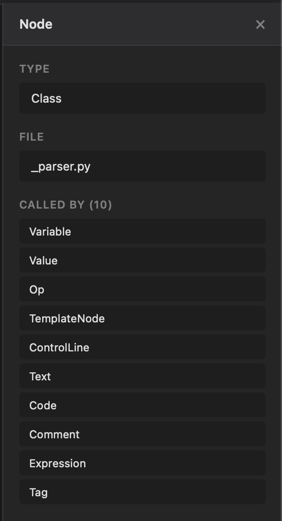
- Nodes represent individual functions or methods
- Arrows indicate call relationships (A -> B means A calls B)
- Colors distinguish different source files
- Click a node to display detailed information
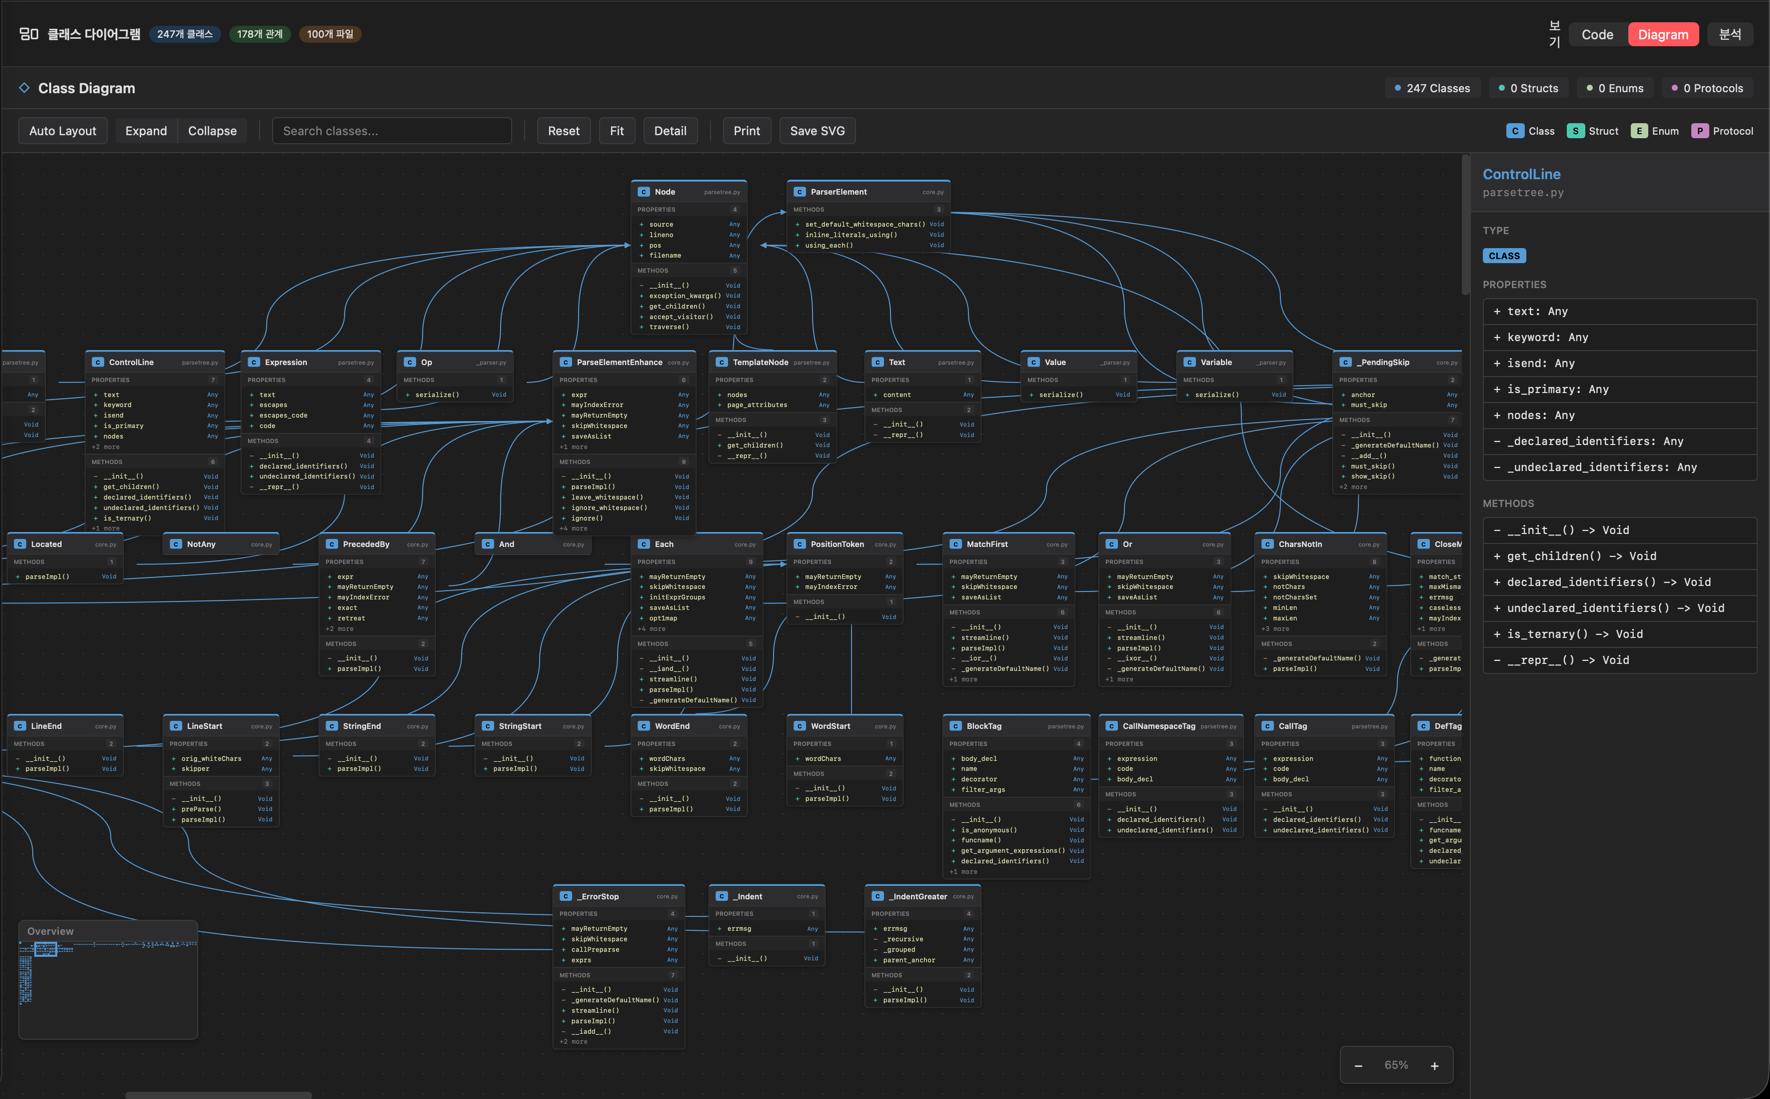
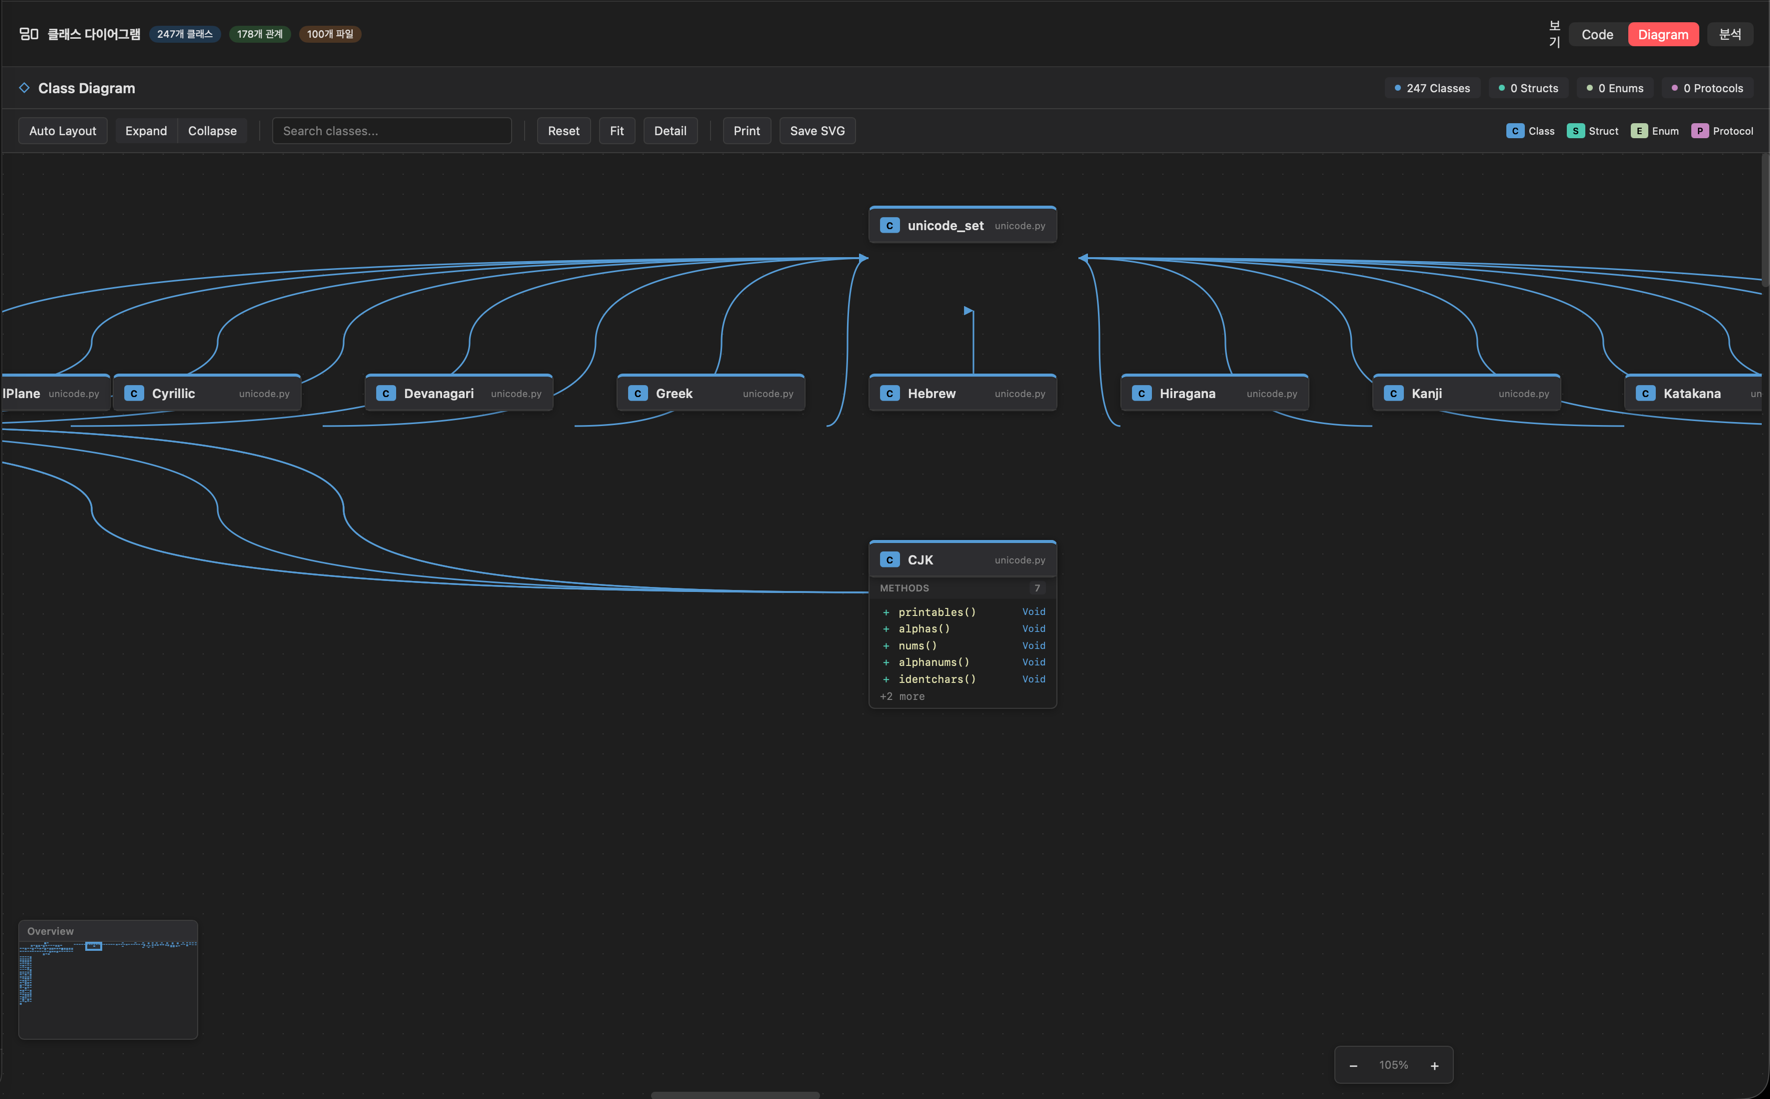
Class Diagram (Class)
Visualizes object-oriented structures in a UML-style diagram.
What It Analyzes
| Element | Description |
|---|---|
| Classes | Extracted from class keyword |
| Structs | Extracted from struct keyword |
| Enums | Extracted from enum keyword |
| Protocols/Interfaces | Extracted from protocol, interface |
| Properties | Instance variables and attributes |
| Methods | Instance methods and static methods |
| Inheritance | Parent-child relationships |
How to Read It
- Boxes represent each class or struct
- Top section shows the class name
- Middle section lists properties
- Bottom section lists methods
- Solid arrows indicate inheritance relationships
- Dashed arrows indicate interface/protocol implementations
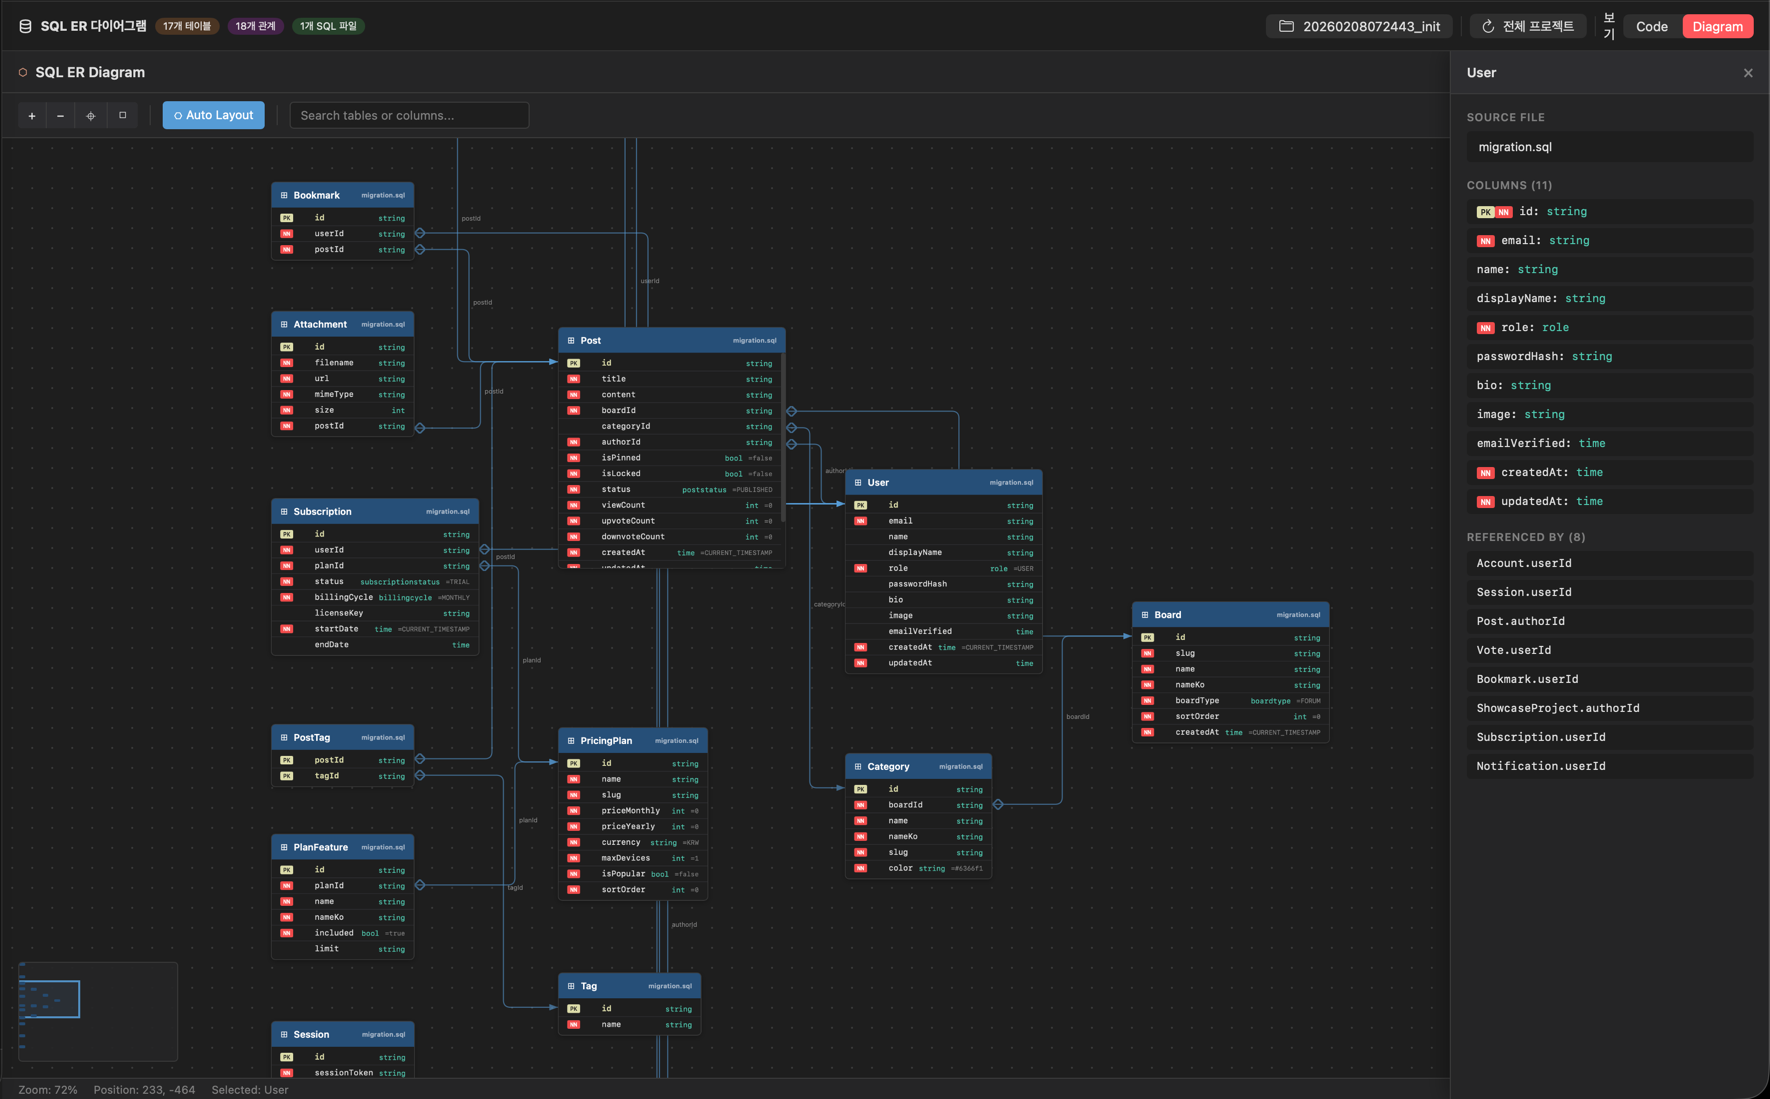
SQL Diagram (SQL)
Visualizes database schemas as ER (Entity-Relationship) diagrams.
What It Analyzes
- Extracts table definitions (CREATE TABLE, model classes)
- Column names and data types
- Primary Key and Foreign Key relationships
- Indexes
How to Read It
- Table boxes represent each table
- Column list shows names, types, and constraints
- Connection lines indicate Foreign Key relationships
- 1:N notation shows relationship cardinality
How to Use
1. Select a Diagram Tab
In the project detail view, click the Flow, Class, or SQL tab.
2. Automatic Analysis
When you select a tab, the project code is automatically analyzed:
- Scans project files
- Extracts structure using the appropriate language parser
- Generates the HTML diagram
- Renders it in a WebView
3. Interactions
The following interactions are available on generated diagrams:
- Zoom — scroll to zoom in/out
- Pan — drag to move around
- Click — select a node to view details
- Hover — highlight elements on mouse over
Performance Limits
The following limits are in place to maintain performance on large projects:
| Item | Limit |
|---|---|
| Max lines per file | 5,000 lines |
| File size limit | 500KB |
| Excluded directories | node_modules, .git, build, __pycache__, dist |
For very large projects, analysis may take some time. You can skip unnecessary files by configuring excluded directories.
Use Cases
Understanding Codebases
Quickly grasp the overall structure of a project you've just joined.
Planning Refactors
Use class diagrams to identify dependencies and plan your refactoring strategy.
Reviewing Database Design
Visualize table relationships with SQL diagrams to review your database design.
Documentation
Include generated diagrams in your project documentation to illustrate code structure.
Next Steps
- QA Management — Issue and bug management
- Project Management — Complete project guide
- AI Agent — AI code generation